Accounting Automation Software Guide
What accounting automation actually covers, how to map your team's maturity level, and how to pick the right tools across data capture, AP, reconciliation, and reporting.
Accounting automation is not a single product. It is a stack of capabilities that spans everything from how a PDF lands in your system to how the month-end trial balance is produced. The companies that get the most out of automation are the ones that understand that stack clearly, know where they currently sit on the maturity curve, and sequence their investments so each layer builds on the one before it.
This guide covers the whole territory: what accounting automation actually includes, how to assess your team's current maturity, the core software layers and vendor landscape, the build-versus-buy decision for mid-market finance teams, a realistic implementation roadmap, how to measure whether it is working, and the failure modes that kill projects before they deliver value.
What accounting automation actually includes
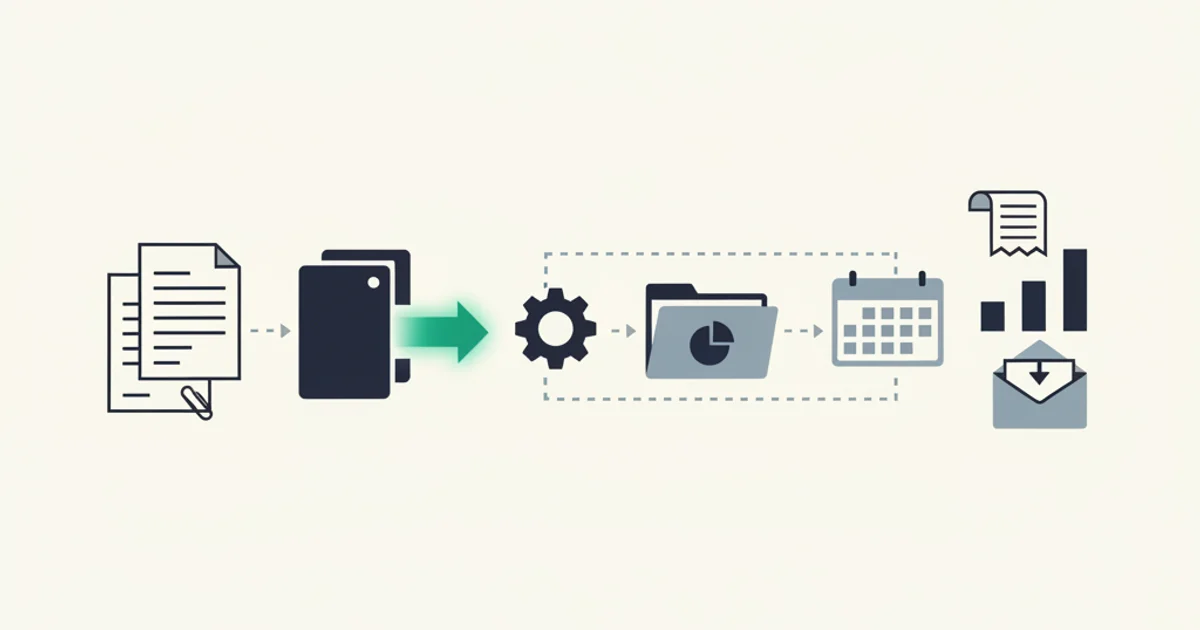
The term gets applied to a lot of different things. Here is a precise breakdown of the six functional areas that make up a complete accounting automation stack.
Document ingestion is the front door: capturing invoices, receipts, bank statements, and supporting documents from every channel they arrive through. Email inboxes. Portal downloads. Forwarded PDFs. Scanned paper. EDI feeds. API-delivered billing records from platforms like Stripe or Amazon Business. If the ingestion layer misses documents, every downstream function operates on incomplete data.
Accounts payable (AP) automation covers the workflow from captured invoice to payment: extraction of structured fields (vendor, amount, due date, GL code, tax), coding against a chart of accounts, routing for approval, three-way matching against purchase orders and receiving documents where applicable, and posting to the ledger. APQC research consistently shows AP as the highest-ROI automation target because the volume is high, the task is repetitive, and errors compound into late fees and reconciliation problems.
Accounts receivable (AR) automation handles the outbound billing cycle: generating invoices, delivering them to customers, tracking payment status, triggering reminders at configurable intervals, and reconciling payments against open invoices. AR automation's primary business impact is on days sales outstanding (DSO), which directly affects working capital.
Bank reconciliation matches transactions in the bank feed against ledger entries. Historically one of the most time-consuming close tasks, it is now largely automatable for businesses that maintain clean AP and AR records. The matching logic handles straightforward one-to-one matches automatically and surfaces exceptions (timing differences, split payments, amounts that don't match exactly) for human review.
Financial close and consolidation covers the month-end and year-end process: journal entries, accruals, amortization schedules, intercompany eliminations for multi-entity businesses, and the preparation of trial balances and financial statements. Automation here is less about eliminating human work and more about eliminating the manual retrieval and assembly work so that human attention focuses on judgment calls.
Reporting and analytics is the output layer: dashboards, budget-versus-actual analysis, cash flow forecasts, and audit-ready financial packages. Automated reporting is only as good as the data flowing into it, which is why sequence matters: garbage-in problems at the ingestion layer show up as wrong numbers in the executive dashboard.
The automation maturity model
Most finance teams sit somewhere on a four-stage maturity curve. Knowing where you are matters because the right investment is different at each stage, and skipping stages tends to waste money.
Level 1: Manual. Every invoice is touched by a human from receipt to posting. Data entry is manual. Approvals happen via email threads or printed routing sheets. Reconciliation is done in a spreadsheet by comparing bank statements line by line against a ledger. A finance team at Level 1 spends the bulk of its time on tasks that produce no analytical value. IOFM data places cost-per-invoice for fully manual operations above $10 per document; some small business environments run much higher.
Level 2: Partially automated. The ledger software (QuickBooks, Xero, Sage) is in place, bank feeds are connected, and some invoices are emailed in. But capture is inconsistent: some invoices are entered manually, some are batch-uploaded as CSV, some are emailed to the bookkeeper who types them in. Approval routing still happens in email. Reconciliation uses the bank feed but requires significant human matching time. Most small and mid-sized businesses operate at Level 2.
Level 3: Mostly automated. A purpose-built capture layer feeds structured data into the ledger without manual data entry for the majority of documents. Approval workflows run through a configured system with defined rules and escalations. Bank reconciliation matches most transactions automatically. The finance team's time shifts from data entry to exception handling and analysis. This is where the cost-per-invoice metrics from APQC's top quartile live.
Level 4: Agent-assisted. AI models handle not just extraction but initial categorization, anomaly detection, and first-pass exception triage. The system flags invoices that deviate from historical vendor patterns, identifies duplicate charges, and suggests GL coding based on transaction history. Humans set policies and handle genuinely novel situations. Very few mid-market companies operate fully at Level 4 today; it is the direction the best tools are heading.
The practical implication: if you are at Level 1, your first move is not to buy a sophisticated analytics platform. It is to stabilize ingestion and get AP under control. If you are at Level 2, the leverage is in connecting the capture layer to the ledger and automating the approval workflow. Level 3 teams usually find the biggest remaining gains in reconciliation speed and close cycle time.
Core automation layers and what each one does
Moving from abstract maturity levels to concrete software architecture, accounting automation typically breaks down into five layers. Each layer has a distinct set of vendors and a distinct failure mode.
Data capture is the ingestion layer. It connects to every channel invoices arrive through, monitors for new documents, and delivers raw files to the extraction layer. For most businesses, "every channel" means email inboxes (Gmail, Outlook), vendor portals that require login and download, forwarding addresses that accept PDFs by email, and occasionally EDI or API feeds. The failure mode here is channel gaps: if your capture tool only handles email but 20% of your invoices require portal login, that 20% falls through and requires manual intervention indefinitely.
Extraction takes raw documents (PDFs, images, scanned paper) and produces structured data: vendor name, invoice number, issue date, due date, line items, subtotal, tax by rate, total, currency. Modern extraction uses AI-powered document understanding rather than template matching or OCR with regex, which means it handles layout variations without per-vendor configuration. The failure mode is low-confidence extractions that post without review, producing wrong numbers in the ledger.
Categorization and coding maps extracted data to chart-of-accounts codes, cost centers, and project tags. Rules-based coding handles the predictable cases (every invoice from AWS codes to Cloud Infrastructure, GL 6010). ML-assisted coding learns from historical coding decisions and suggests codes for new vendors. The failure mode is miscoded transactions that distort financial reporting without being obvious in the ledger.
Workflow and approval routing moves invoices through a configurable approval chain based on amount thresholds, vendor type, department, or GL code. The failure mode is rigid configurations that create bottlenecks: a workflow that requires the CFO to approve every invoice above $500 is worse than no workflow at all.
Ledger and system sync pushes approved, coded invoices into the accounting system and exports to downstream tools. This is where the integration map matters. For Stripe billing data, our Stripe portal integration handles the full sync cycle. For Amazon Business, the Amazon Business integration handles the portal download complexity that email-only tools miss. The integrations overview covers the full connection map across ERP, accounting, and storage destinations.
Vendor landscape map
The accounting automation market has four distinct segments. Most businesses need tools from at least two of them.
Ledger systems are the system of record: QuickBooks Online, Xero, Sage Intacct, NetSuite, Microsoft Dynamics 365 Finance. These hold the chart of accounts, produce financial statements, and are the source of truth for audit purposes. They have built-in automation for some tasks (bank feed reconciliation, recurring journal entries) but are not designed to handle document ingestion from complex environments.
AP and document automation platforms sit in front of the ledger and handle ingestion, extraction, and approval routing. Major vendors in this segment include Bill.com (strong for small-mid market AP), Tipalti (mid-to-enterprise, strong on global payments and tax compliance), Stampli (AI-assisted AP with strong approval workflow), Rossum (extraction-focused, strong on complex and international documents), and Inbox Ledger (email-first ingestion with AI extraction, designed for businesses where invoices arrive primarily via email and vendor portals).
Reconciliation and close management tools focus on the back end of the accounting cycle. FloQast and Blackline address close management and reconciliation checklists for mid-to-large finance teams. Numeric and Tabs handle variance analysis and flux commentary. These tools assume clean data is already in the ledger and add structure to the close process itself.
Reporting and analytics tools sit at the output layer. Mosaic, Cube, and Pigment handle FP&A. Fathom and Spotlight Reporting work with QuickBooks and Xero for smaller businesses. Microsoft Power BI and Google Looker cover the self-service analytics tier. The caveat that applies to every tool in this segment: the output is only as good as the ledger data feeding it, which circles back to the ingestion and extraction layers.
One practical note for teams evaluating the AP automation segment: the extraction accuracy claims from vendors vary widely and are often measured on clean, standard-format documents. Test every tool on your actual invoice population, including the vendors with unusual layouts, the multi-page statements, and the PDFs produced by older billing systems. The gap between claimed accuracy and actual accuracy on your specific document set is usually where implementation surprises come from.
Build vs. buy for a mid-market finance team
Finance teams with engineering resources sometimes consider building custom automation rather than buying. Here is a realistic assessment.
The components that make sense to buy: document extraction, because training an accurate extraction model requires millions of labeled documents and ongoing retraining as vendor layouts change; integration connectors, because maintaining reliable API connections to QuickBooks, Xero, NetSuite, Google Drive, and a dozen other systems is a non-trivial engineering maintenance burden; and approval workflow infrastructure, because configuring a general workflow engine to handle finance-specific edge cases (three-way matching, partial approvals, delegation chains) takes significant time.
The components where internal development sometimes makes sense: custom reporting on top of ledger data, where your GL is the source of truth and you are building dashboards that read from it; company-specific categorization rules that encode proprietary business logic about how your cost structure is organized; and integrations with systems that have no commercial connector (custom ERP configurations, homegrown procurement systems).
The most expensive mistake mid-market teams make is building what should be bought. A team that builds its own PDF extraction pipeline spends six months on a problem that has well-funded commercial solutions, then spends ongoing engineering time maintaining it as vendor layouts change, dealing with edge cases in different languages and formats, and debugging the occasional misparse that produces wrong financial data. The opportunity cost is high: those engineering hours could go toward the integrations and reporting logic that are genuinely specific to your business.
The exception is large enterprises with procurement data science teams and very high document volumes where the economics of building proprietary extraction and categorization infrastructure change. For everyone else, buy the extraction layer and build the company-specific logic on top of it.
Start for free and extract your first 10 invoices without a credit card.
Implementation roadmap
The most successful implementations stage automation by layer and consolidate at each step before moving to the next. Here is a realistic timeline.
First 30 days: stabilize ingestion.
The goal of the first 30 days is complete, reliable document capture. Not extraction, not routing, just capture. Connect every channel invoices arrive through to a single intake point. For most teams this means connecting the primary invoice inbox (Gmail or Outlook), setting up a forwarding address for vendors who send invoices to multiple inboxes, and identifying the top 5 to 10 vendors whose invoices require portal login. For a practical starting point on email-based capture, the guide on invoice processing automation covers the email ingestion pattern in depth.
Measure at 30 days: can you produce a complete list of every invoice received in the prior month, with no known gaps? If not, identify the missing channels before proceeding.
First 90 days: automate AP.
With reliable ingestion in place, layer on extraction and approval routing. Configure the chart-of-accounts mapping for your top 20 vendors by volume. Set up the approval workflow: amount thresholds, approver assignments, escalation rules. Connect the output to your ledger (QuickBooks, Xero, or equivalent). Run the automated and manual processes in parallel for the first two weeks to validate extraction accuracy before switching fully to the automated flow.
Measure at 90 days: what is your cost-per-invoice and what percentage of invoices are posting without manual intervention? Top-quartile benchmarks from APQC put touchless processing above 50% for mature AP teams; 70-80% is achievable for businesses with consistent vendor bases.
First year: close the loop on reconciliation and reporting.
The final stage is using the clean ledger data that automated AP produces to shorten the close cycle and improve reporting quality. Connect bank feeds from every account. Configure automatic matching rules for the transaction types that reconcile cleanly (recurring SaaS charges, payroll, standard vendor payments). Build variance analysis reports that compare current-period spending to budget and prior-period actuals. The goal by end of year one: a monthly close that completes in under five business days with the majority of reconciliation completed automatically.
Measuring ROI
Three metrics produce the clearest picture of whether accounting automation is working.
Cost per invoice processed. APQC's annual benchmarks consistently show that top-quartile organizations process invoices for under $2.94 each, while bottom-quartile manual operations spend $10 to $15 per invoice including labor. Calculating your own baseline requires honest time-tracking across receipt, coding, approval, and posting steps. Run the baseline before implementing automation, then recheck at 90 days and one year. The delta is your automation dividend.
Days sales outstanding (DSO). AR automation's primary impact shows up here. DSO measures the average number of days between an invoice being issued and payment being received. For a $5 million annual revenue business, cutting DSO by five days releases roughly $68,000 in working capital. Automated invoice delivery, payment status tracking, and configurable reminder sequences are the mechanism; the benchmark from IOFM is that automated AR follow-up reduces DSO by 3 to 7 days depending on customer payment behavior.
Financial close cycle time. The metric that matters to CFOs. Top-quartile companies close in under five business days; the median is closer to ten. Close cycle time depends on reconciliation completeness, journal entry preparation, and financial statement assembly. Automation contributes to all three, with the biggest impact on reconciliation speed. Track this monthly; it is the metric most clearly tied to management's ability to make decisions on current information rather than last month's approximation.
A fourth metric worth tracking but harder to quantify: error-related rework. Manual data entry produces errors that surface during reconciliation, audit, or when a vendor disputes a payment amount. Each error generates correction work that typically takes longer than the original entry. Automated extraction with a confidence-based review queue eliminates most of these errors at the source.
Common pitfalls that kill automation projects
Eight failure modes appear consistently across failed implementations. Most are avoidable with the right sequencing.
Starting with the back end, not the front. Teams that automate reporting before they automate ingestion produce fast reports full of wrong numbers. The right sequence is always: capture first, extraction second, routing third, ledger sync fourth, reporting last.
Accepting one channel and calling it done. Email-only ingestion misses portal invoices, EDI feeds, and paper. Portal-only automation misses email attachments and forwarded PDFs. A complete intake layer covers every channel the business actually uses, not just the most convenient one to connect.
Underestimating vendor layout diversity. A tool that is demonstrated on clean Stripe and Amazon invoices may fail on the German hosting provider with unusual VAT decomposition, the Thai supplier who emails JPEG scans instead of PDFs, or the landlord who sends Word documents renamed as PDFs. Test extraction against the full range of your actual vendor base before selecting a tool.
Skipping the confidence-based review queue. Posting extracted data without a quality gate means that low-accuracy extractions go straight to the ledger. The right architecture: high-confidence extractions post automatically, low-confidence extractions surface in a review queue. The threshold and review workflow are more important than the headline accuracy number.
Automating a broken process. If the existing AP process has unclear coding policies, inconsistent approval hierarchies, or vendors on too many payment terms to manage, automation makes those problems faster, not better. Document the intended process before automating it.
Ignoring the exception handling path. Every automation system generates exceptions: invoices that don't match a PO, vendors not in the master file, amounts outside normal ranges. If the exception path requires the same manual effort as processing without automation, throughput gains disappear in the exception queue. Design the exception workflow as carefully as the straight-through path.
Treating the first implementation as the final implementation. Vendor layouts change. New billing channels emerge. Company structure changes with acquisitions or new subsidiaries. Accounting automation is a maintained system, not a one-time project. Budget for ongoing configuration, vendor onboarding, and model updates when evaluating total cost of ownership.
Measuring only time saved, not accuracy. A fast system that miscodes 5% of invoices saves time on data entry and costs it back on reconciliation and audit corrections. Measure both throughput and accuracy, and weight accuracy higher for tax-sensitive categories.
The pattern that works: begin with a clear inventory of where documents come from, build a reliable capture layer that covers all channels, add extraction with a quality gate, connect to the ledger with a tested coding ruleset, and only then add reporting and analytics on top. Companies that follow this sequence typically hit measurable ROI within 90 days. Companies that skip straight to the interesting parts (AI categorization, real-time dashboards) and neglect the plumbing spend six months debugging why the numbers are wrong.
For a direct comparison of tools across the AP automation segment, see accounting software for small business and our head-to-head coverage at accounting automation alternatives. If the core problem is AI-assisted accounting specifically, AI agent for accounting covers the agent-assisted tier in detail.